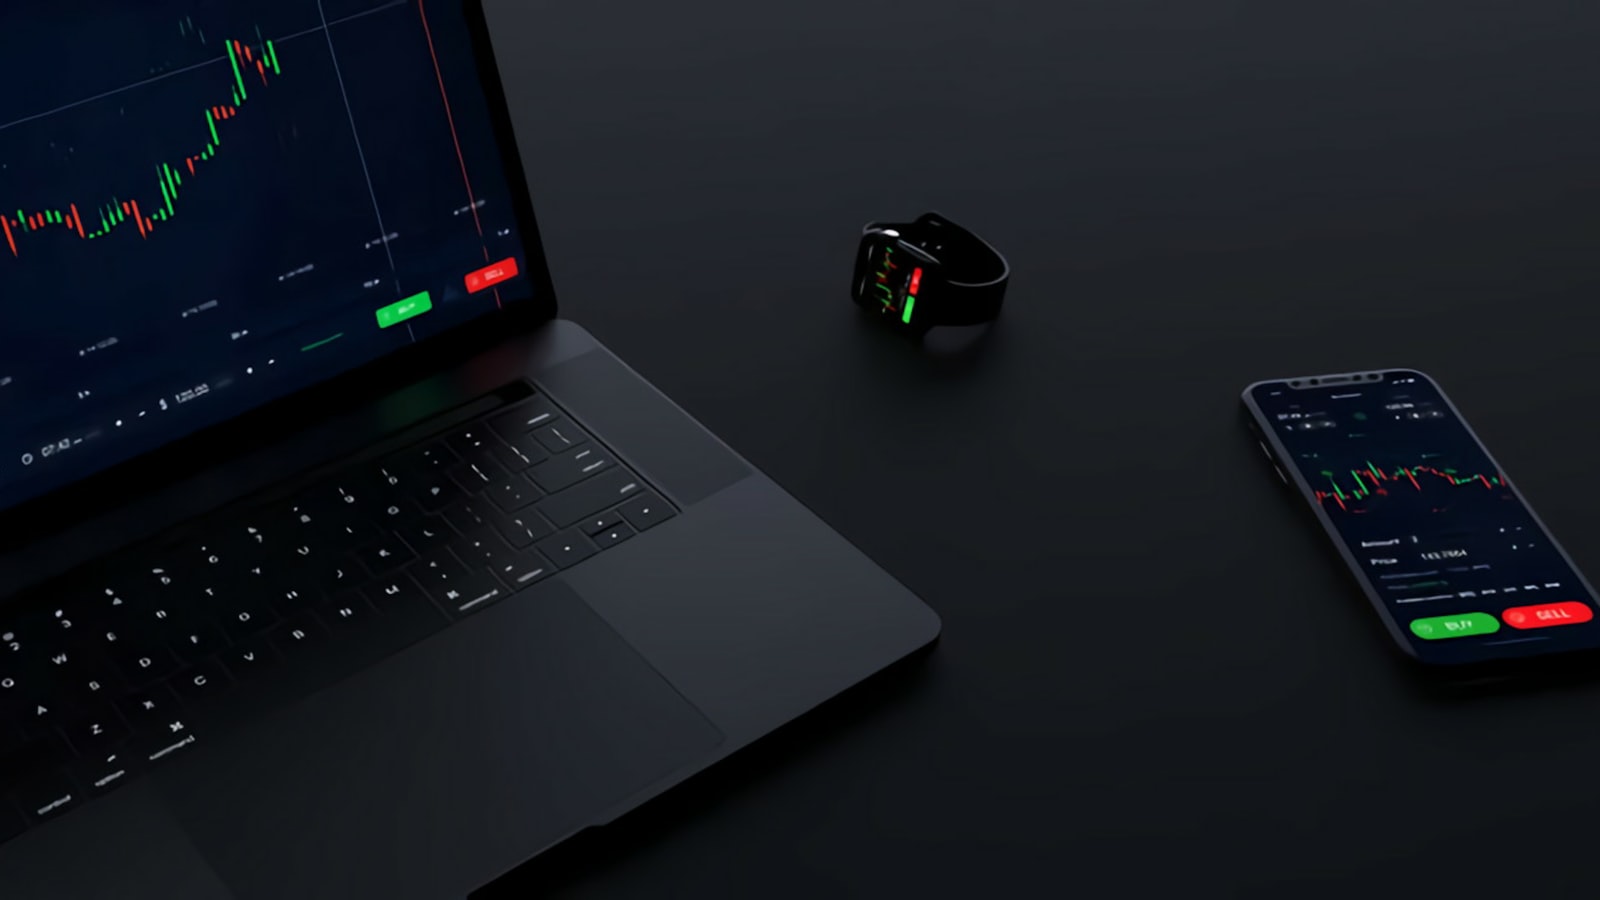
When a massive institutional player wants to take a $50 million directional bet on a stock, they rarely buy the underlying shares directly. It is too inefficient. Instead, they turn to the options market. They leverage the derivatives chain to maximize their capital efficiency and hide their intent.
But here is the truth about the options market: you cannot hide volume.
Every single contract traded is recorded. For retail traders, tracking unusual options activity is the closest thing to legally front-running institutional money. When you know how to read the tape, you stop guessing what the market will do and start following the capital that actually moves the needle.
However, in 2026, simply looking for "high volume" is no longer enough. The market is saturated with algorithmic hedging, multi-leg spreads, and zero-days-to-expiration (0DTE) noise. To find actionable signals, you need to understand the mechanics of order flow and leverage AI to filter the signal from the noise.
Understanding Unusual Options Activity
Unusual options activity (UOA) occurs when the trading volume on a specific options contract vastly exceeds its historical average or outpaces the current open interest. But high volume alone is not a signal; it is just a data point.
To determine if UOA represents a high-conviction trade setup, we must analyze how the order was executed.
Sweeps vs. Block Trades
When institutions trade, they use specific execution strategies. The two most critical to watch are block trades and sweep orders.
Block Trades: A block trade is a massive, privately negotiated transaction executed outside the open market to prevent immediate price slippage. While a large block of calls might look bullish, it could simply be one institution closing a position with another, or a hedge against a massive short stock position. Block trades are informative, but they lack urgency. They do not typically drive immediate price action because they are carefully structured not to disrupt the market maker's book.
Sweep Orders: Sweeps are the holy grail of options flow. A sweep occurs when a buyer splits a large order across multiple exchanges to aggressively sweep all available liquidity at the current ask price. A sweep indicates extreme urgency. The buyer does not care about getting a perfect fill price; they only care about getting filled right now before the underlying stock moves. When you see repeated call sweeps on a stock, it is a glaring red flag that institutional money expects an imminent upside move. This urgency often suggests they possess information or analysis that leads them to believe the stock will gap up shortly.
Volume vs. Open Interest (OI)
A crucial metric in analyzing UOA is the ratio of Volume to Open Interest.
- Volume: The number of contracts traded today.
- Open Interest: The total number of outstanding contracts held by market participants.
If a contract has an OI of 500, but today's volume is 10,000, that is mathematically significant. It means new positions are being opened at an aggressive rate. Conversely, if volume is high but still significantly below the OI, the activity might just be routine closing of existing positions. Always look for volume that dwarfs the existing open interest. This Volume/OI ratio is the primary filter used by professional flow traders to ignore the daily noise of index hedging and focus on targeted, single-stock bets.
The Noise Problem: Hedging vs. Directional Bets
The biggest mistake retail traders make when following unusual activity is assuming every large call purchase is bullish and every large put purchase is bearish. This is demonstrably false.
Institutions use options primarily for risk management. A hedge fund might buy $10 million in SPY puts, not because they think the market will crash, but because they are holding a $500 million long portfolio and need to hedge against downside risk. Following that put flow blindly will destroy your account.
How AI Filters the Flow
This is where traditional UOA scanners fail and AI-driven platforms like OptionScout.ai excel. You cannot manually analyze the delta, gamma, and underlying stock volume for every large options trade in real-time.
AI models are trained to differentiate between hedging and directional betting by analyzing contextual data:
- Underlying Stock Action: Is the stock breaking out of a technical range simultaneously with the options flow? If a stock is consolidating and suddenly experiences a barrage of call sweeps hitting the ask, the AI flags this as highly actionable.
- Multi-Leg Detection: Is the large call purchase actually just the long leg of a complex iron condor or a protective collar? AI instantly pairs associated trades executed across different exchanges to reveal the true net-delta of the position, preventing you from misinterpreting a hedge as a directional bet.
- Historical Flow Accuracy: AI tracks the historical win rate of specific institutional flow patterns. If an algorithm detects a massive sweep from an entity that has a 85% success rate on directional tech bets prior to earnings, it surfaces that signal with a high confidence score.
Spotting the Gamma Squeeze Setup
In the modern options landscape, the most explosive moves are driven by market maker hedging—specifically, the gamma squeeze. Tracking unusual activity is the primary method for spotting a gamma squeeze before it happens.
When institutions aggressively buy out-of-the-money (OTM) calls, the market makers who sell them those calls are left short gamma. To remain delta-neutral, the market makers are forced to buy the underlying stock.
The Gamma Feedback Loop
If the stock price begins to rise toward those strike prices, the delta of those OTM calls increases rapidly (this is gamma in action). The market makers must buy more stock to hedge their accelerating risk. This buying pressure pushes the stock price even higher, forcing them to buy even more stock.
By tracking unusual options activity, you can identify the specific strike prices where market makers are dangerously short gamma. These strikes act as magnets. When a stock approaches a massive wall of open interest heavily tilted toward calls, a gamma squeeze becomes highly probable. AI platforms can map these gamma exposures, giving retail traders a topographical map of where violent price action is likely to occur.
Building a High-Conviction Trade Setup
Tracking unusual options activity is a strategy, not a trading plan. To execute successfully, you must combine flow data with technical analysis and strict risk management. Institutional flow should serve as your radar, but your technical analysis dictates your entry and exit points.
1. Identify the Anomaly
Use an AI scanner to find a contract with a Volume/OI ratio greater than 3.0, driven primarily by sweep orders executed at the ask price. Ensure the expiration date is logical (e.g., massive flow expiring right after an upcoming earnings report or FDA announcement). If the flow does not align with a known catalyst, it may be insider buying, which is an even stronger signal.
2. Confirm the Technical Setup
Never trade flow in a vacuum. Look at the chart. If you see massive call sweeps on AMD, check if the stock is approaching a major resistance level, bouncing off a moving average, or breaking out of a consolidation pattern. Flow combined with a technical breakout creates a high-conviction setup. If the flow contradicts the prevailing trend, wait for technical confirmation before entering the trade.
3. Define the Risk
Institutions have billions in capital; they can afford to be wrong and roll their positions out in time. You cannot. When following institutional flow, structure your trade using defined-risk strategies. Instead of buying naked calls and suffering theta decay, consider a debit spread. This caps your maximum loss while still allowing you to capitalize on the directional move the institutional flow predicted.
The Psychological Edge of Trading Flow
Trading based on technical analysis alone can be psychologically taxing. You are constantly second-guessing whether a breakout is genuine or a fake-out. Unusual options activity provides the fundamental conviction required to hold a winning trade through minor pullbacks.
When you know that an institution just dropped $5 million on calls expiring in two weeks, you are less likely to panic-sell when the stock drops 1% the next morning. You understand that the smart money has a thesis, and you are simply riding their coattails. This conviction is what separates consistently profitable traders from those who constantly get chopped out of winning setups.
Key Takeaways
- Focus on Sweeps: Block trades are often negotiated hedges. Sweep orders hitting the ask price indicate urgency and directional conviction.
- Volume Must Exceed OI: To ensure new positions are being opened, look for daily volume that significantly outpaces the existing open interest.
- Filter the Noise: Do not blindly follow every large trade. Use AI tools to filter out complex multi-leg hedges and isolate true directional bets.
- Combine with Technicals: Institutional flow provides the thesis; technical analysis provides the entry point. Always align flow data with the underlying chart structure.
The options market is a zero-sum game. Every time you buy a contract, someone else is selling it. By learning to track unusual options activity, you stop trading against the smart money and start trading alongside it. The tools to decode this data—once reserved for Wall Street quants—are now available to retail traders. The edge belongs to those who know how to read the tape.